
Physical Climate Risk in the Era of IFRS S2
The International Sustainability Standards Board (ISSB) released IFRS S2 (Climate-related Disclosures) to bring capital market rigor to sustainability reporting. Unlike previous voluntary reporting protocols, IFRS S2 requires entities to disclose verifiable information about climate-related risks and opportunities that could affect the entity’s cash flows, access to finance, or cost of capital over the short, medium, and long term.
A critical pillar of IFRS S2 is the identification and assessment of physical climate risks—both acute (event-driven hazards such as flash floods and convective storms) and chronic (longer-term shifts such as sustained high temperatures and sea-level rise). Under paragraphs 10 through 14, companies must demonstrate the resilience of their strategy and business model to climate-related changes, using climate-related scenario analysis commensurate with their circumstances.
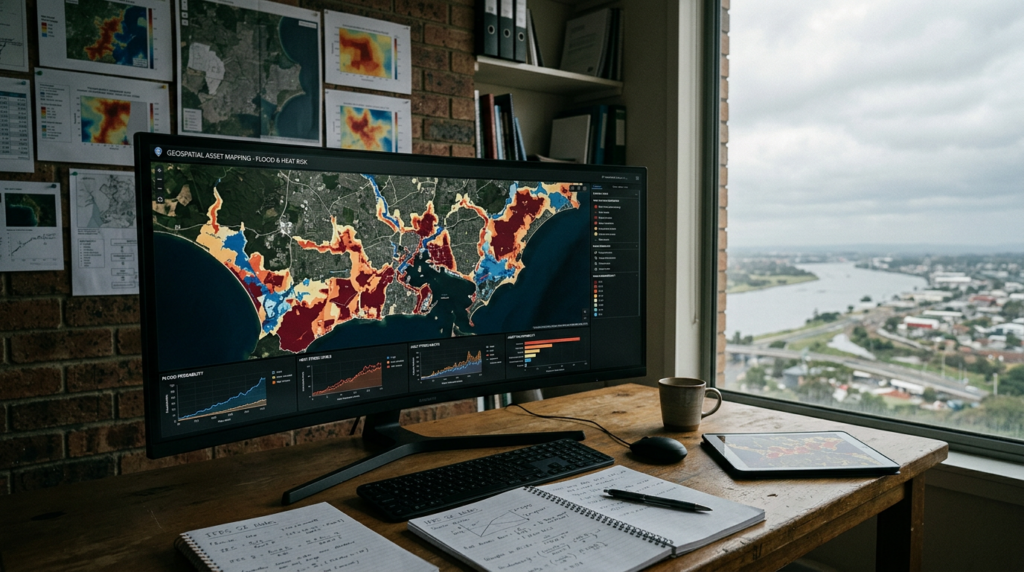
High-level, qualitative assessments are no longer sufficient to satisfy institutional investors and assurance providers. To determine material exposure, enterprises must evaluate their operations and upstream/downstream dependencies at the physical asset level. Geospatial asset mapping provides the foundation for this quantitative modeling, enabling organizations to place balance-sheet assets against spatially explicit climate hazard projections.
The Core Methodological Architecture
Effective physical risk modeling under IFRS S2 combines geographic information systems (GIS), atmospheric climate models, vulnerability curves, and financial valuation techniques. A robust methodology follows four sequential phases: asset onboarding, hazard ingestion, vulnerability modeling, and financial impact quantification.
1. Asset Geocoding and Attribute Parameterization
Physical risk assessment begins by constructing an accurate geodatabase of physical assets. Reporting entities frequently hold real estate, manufacturing facilities, warehouses, and energy assets in fragmented operational databases without geographic coordinates.
To build an audit-ready asset baseline, organizations must convert site addresses into high-precision latitude and longitude coordinates. However, point coordinates are often inadequate for large-scale industrial complexes, linear infrastructure, or expansive agricultural holdings. In these instances, spatial bounding polygons must be generated to capture the complete operational footprint.
Alongside coordinates, the asset database must capture operational attributes that dictate physical vulnerability and financial materiality:
- Asset category and structural design: Building construction materials, foundation type, number of stories, elevation of electrical and mechanical systems above ground level, and presence of on-site drainage or cooling infrastructure.
- Financial values: Gross carrying value, replacement cost, net book value, and historical insurance coverage limits.
- Operational throughput: Site-specific contribution to annual revenue, production capacity, dependency on continuous grid power, and operational downtime tolerances.
- Supply chain criticality: Availability of redundant sites and local transportation node connectivity.
2. Downscaling Climate Hazard Layers: Floods and Extreme Heat
Once asset locations are georeferenced, they are intersected with climate hazard datasets derived from Global Climate Models (GCMs) and Regional Climate Models (RCMs). For IFRS S2 compliance, modeling should incorporate credible scientific trajectories, specifically the Shared Socioeconomic Pathways (SSPs) used by the Intergovernmental Panel on Climate Change (IPCC) Sixth Assessment Report (AR6), such as SSP1-2.6, SSP2-4.5, and SSP5-8.5.
Physical risk modeling generally targets two dominant peril categories: flooding and extreme heat. Both demand specific spatial and temporal modeling approaches.
Flood Hazard Modeling (Acute Risk)
Flood modeling must address three distinct hydrological mechanisms:
- Fluvial (Riverine) Flooding: Driven by prolonged precipitation that causes rivers to exceed their carrying capacity. Hydraulic modeling routes runoff through terrain networks to calculate water surface elevations across return periods (such as 1-in-50, 1-in-100, and 1-in-500 year recurrence intervals).
- Pluvial (Surface Water) Flooding: Caused by localized, high-intensity rainfall events that overwhelm municipal stormwater drainage systems, independent of river proximity. This requires high-resolution Digital Elevation Models (DEMs) to simulate surface flow dynamics.
- Coastal Flooding and Storm Surge: Generated by tropical and extratropical storms compounding mean sea-level rise. Coastal bathymetry, tidal cycles, and wave run-up calculations determine the extent of inundation.
Under IFRS S2, assets must be evaluated across forward-looking time horizons (e.g., 2030, 2040, and 2050). Hydraulic models simulate how climate-induced shifts in precipitation intensity alter baseline 100-year flood extents, shifting low-probability events into high-probability operational disruptions.
Heat Hazard Modeling (Acute and Chronic Risk)
Unlike floods, which are hyper-localized, heat stress is a broad geographic peril. Modeling extreme heat requires tracking two dimensions:
- Chronic Thermal Shift: Increases in annual Cooling Degree Days (CDD), changes in mean seasonal temperatures, and shifts in sustained baseline heat that impact industrial cooling demand, refrigeration loads, and agricultural yields.
- Acute Heat Extremes: Increases in the frequency and duration of heat waves, defined by days exceeding local 95th or 99th percentile historical temperatures, or sustained maximum dry-bulb temperatures above 35°C to 40°C.
- Wet-Bulb Temperature: A measure that combines heat and humidity. Wet-bulb temperatures exceeding 31°C significantly impair outdoor human labor productivity, while conditions approaching 35°C represent physiological limits where metabolic heat dissipation fails.
3. Developing Vulnerability Curves (Damage Functions)
Spatial exposure does not automatically equate to financial damage. An asset located in a 100-year flood zone that is elevated on pilings will suffer far less loss than an unmitigated ground-level facility. Translating exposure into damage requires vulnerability functions (also called stage-damage curves).
For flood hazards, a stage-damage curve calculates the structural and content damage ratio (ranging from 0% to 100%) as a direct function of water depth relative to the ground floor elevation. For instance, 0.5 meters of internal inundation might yield an expected structural loss of 15% and a contents loss of 40%, whereas 2.0 meters may cause catastrophic structural failure and total loss of machinery.
For heat hazards, vulnerability curves correlate sustained ambient temperatures with operational efficiency loss. Examples include:
- Labor Capacity Reduction: Stepwise reductions in permissible working hours for manual and outdoor labor in accordance with occupational safety thresholds.
- Equipment Derating: Efficiency penalties on HVAC units, industrial chillers, and data center cooling infrastructure, which consume exponentially more power while experiencing degraded thermal capacity as external temperatures rise.
- Thermal Threshold Violations: Direct production shutdowns when manufacturing equipment limits are breached or cold-storage chains fail.
4. Financial Translation Under IFRS S2 and Financial Accounting Linkages
Paragraph 15 of IFRS S2 expects entities to provide quantitative information on how physical climate hazards affect the balance sheet, income statement, and cash flow projections. This analysis links engineering estimates directly to standard accounting concepts:
Expected Annual Damage (EAD)
By integrating the probability of various hazard intensities across return periods with their respective vulnerability functions, modeling produces an Expected Annual Damage (EAD) metric. EAD represents the annualized capital reserve an entity must theoretically retain to cover unmitigated physical climate damages.
Asset Impairment and Useful Life Adjustments (IAS 36 and IAS 16)
Where physical modeling reveals that a production facility will face frequent flood events or chronic thermal degradation that lowers operational capacity, the entity must assess whether the carrying value of the asset is recoverable. Under IAS 36 (Impairment of Assets), future cash flow projections used in Value in Use (VIU) calculations must reflect anticipated climate damage and heightened operating expenses, potentially triggering immediate balance sheet write-downs.
Business Interruption and Gross Margin Compression
In addition to direct capital replacement costs, geospatial modeling measures operational downtime. Water depths of 1 meter may require three to six months of remediation, during which the facility generates zero output while continuing to incur fixed overheads. For heat events, modeling estimates the additional electricity expenditure required to run cooling systems alongside production output losses.
Capital Expenditure (CapEx) Planning for Adaptation
IFRS S2 requires disclosures regarding adaptation strategies. Quantifying exposure allows management to conduct cost-benefit analyses on protective capital projects—such as constructing perimeter flood walls, installing backflow valves, retrofitting building envelopes, or upgrading industrial cooling systems. Disclosures can detail the CapEx required to mitigate risk alongside the resulting drop in modeled EAD.
Methodological Challenges and Quality Controls
Executing physical risk analysis across diverse global portfolios presents substantial operational hurdles. Technical teams and advisory partners must manage several common modeling failure points:
Resolution Mismatches
Global circulation models often operate on resolutions of 25 to 100 kilometers. This scale is entirely inadequate for assessing flood risk, which is dictated by local micro-topography, storm drains, and elevation changes of less than one meter. Analysts must employ hydro-conditioned Digital Elevation Models downscaled to resolutions of 30 meters or finer, supplemented by local terrain datasets where available.
The False Security of Global Averages
Aggregating portfolio risk into single enterprise-level scores obscures severe facility-level vulnerabilities. A company with 200 sites may appear to have low overall risk on an aggregated basis, yet three critical distribution hubs—representing 40% of group operating cash flows—may be located directly within coastal surge or acute flood pathways. Physical risk models must retain asset-level resolution throughout the analysis.
Interconnected Infrastructure Vulnerabilities
An asset may experience zero direct physical inundation while suffering weeks of shutdown because off-site electrical substations, municipal water networks, or arterial transport corridors are flooded. Advanced physical risk frameworks incorporate critical infrastructure buffers around owned assets to capture secondary operational exposures.
Implementing an Audit-Ready Disclosure Process
Assurance providers are increasingly scrutinizing climate disclosures for consistency with financial statements. To prepare for limited and reasonable assurance cycles, corporate sustainability and finance functions should adopt a disciplined implementation workflow:
- Reconcile the asset registry: Ensure every owned and leased location reported in the fixed asset register is mapped to geographic coordinates, validated against satellite imagery, and linked to its respective legal entity and operational segment.
- Document scenario assumptions: Explicitly record the chosen IPCC SSP scenarios, baseline reference periods (e.g., 1995–2014), forward time horizons (e.g., 2030 and 2050), and underlying climate models.
- Justify vulnerability assumptions: Retain technical documentation explaining the damage curves applied to various building typologies, replacement value assumptions, and historical loss calibrations.
- Bridge the gap between sustainability and finance: Ensure risk management teams deliver quantitative outputs in metrics that financial controllers can directly apply to discounted cash flow models, impairment tests, and annual strategic planning.
Physical risk modeling under IFRS S2 is fundamentally an operational resilience and financial durability analysis. By grounding corporate disclosures in high-resolution geospatial intelligence, organizations satisfy regulatory reporting mandates while building defensive balance sheets capable of withstanding accelerating physical climate pressures.
Organizations seeking to evaluate physical asset exposure, model climate hazards against corporate footprints, and align disclosures with IFRS S1 and S2 requirements can partner with ForestTwin’s advisory and spatial analytics team. Visit ForestTwin Contact to discuss your climate scenario modeling and sustainability disclosure needs.